
|
22.03.2016 07:30:00
|
Memscap Earnings for Fiscal Year 2015: Net Cash Increase of Eur 1.4 Million
Regulatory News:
This Smart News Release features multimedia. View the full release here: http://www.businesswire.com/news/home/20160321006167/en/
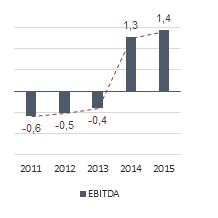
Variation in EBITDA (in million euros)
Memscap (Paris:MEMS), the leading provider of innovative solutions based on MEMS (micro-electro-mechanical systems) technology, today announced its earnings for fiscal year 2015 ending December 31, 2015.
Analysis of the consolidated income statement
Matching previous quarterly press releases, revenue for FY 2015 amounted to EUR 12.6 million (US$ 14.0 million). Consolidated revenue distribution by market segment over FY 2015 is as follows:
| Market segments | Revenue (M€) | % | ||
| Aerospace | 5.2 | 41% | ||
| Medical / Biomedical | 3.2 | 26% | ||
| Optical Communications / Adaptive Optics | 3.2 | 25% | ||
| Mass Market | 1.0 | 8% | ||
| Total | 12.6 | 100% |
(Any apparent discrepancies in totals are due to rounding.)
MEMSCAP consolidated earnings for FY 2015 are given by the following table:
| (In million euros) |
For the year ended
31 December 2015 |
For the year ended
31 December 2014 |
||
|
Revenue
- Standard products* - Custom products |
12.6
7.5 5.1 |
13.2
8.1 5.1 |
||
| Gross margin | 4.6 | 4.1 | ||
| Operating expenses** | (3.8) | (3.7) | ||
| Operating profit / (loss) | 0.8 | 0.4 | ||
| Financial profit / (loss) | (0.1) | (0.2) | ||
| Net profit / (loss) | 0.7 | 0.2 |
(Financial data were subject to an audit by the Group’s statutory auditors who will issue their reports at a later date. On March 21st, 2016, the MEMSCAP board of directors authorized the release of the FY 2015 consolidated financial statements. Any apparent discrepancies in totals are due to rounding.)
* Including the royalties from the dermo-cosmetics segment.
** Net
of research & development grants.
The gross margin rate ended at 37% of consolidated sales for FY 2015 which represents an increase by 6 points compared to the previous year. This improvement resulted mainly from the MEMSCAP business strategy focused on high-added value market segments and the amplification of productivity within the production entities of the Group. Consolidated gross margin for FY 2015 amounted to EUR 4.6 million against EUR 4.1 million for FY 2014.
Operating expenses (net of research & development grants) amounted to EUR 3.8 million for FY 2015. This amount is in line with the previous year (FY 2014: Net operating expenses at EUR 3.7 million).
The significant growth of the Group’s gross margin over FY 2015 combined with the control of operating costs led to a EUR 0.8 million operating profit (representing 6.4% of consolidated revenue) compared to an operating profit at EUR 0.4 million for FY 2014 (representing 2.8% of consolidated revenue).
The financial loss for FY 2015 amounted to EUR 0.1 million compared to a financial loss of EUR 0.2 million for FY 2014. This loss mainly included foreign exchange losses on Group’s sales for EUR 0.1 million (FY 2014: Foreign exchange losses of EUR 0.2 million).
Finally, the net profit for FY 2015 amounted to EUR 0.7 million (representing 5.3% of consolidated revenue) compared to a net profit of EUR 0.2 million for FY 2014 (representing 1.4% of consolidated revenue).
Net cash increase of EUR 1.4 million over FY 2015
The positive operating cash flow amounted to EUR 1.5 million for FY 2015 compared to EUR 1.7 million for FY 2014. At December 31, 2015, consolidated available cash was EUR 3.9 million including cash and short term deposits as well as cash investments (Corporate bonds) recorded under financial assets available for sale. In addition to this amount, the available unused credit lines amounted to EUR 0.4 million at December 31, 2015.
At December 31, 2015, net cash was EUR 2.3 million increasing by EUR 1.4 million compared to the net cash position at December 31, 2014.
MEMSCAP shareholder’s equity totaled EUR 17.8 million at December 31, 2015.
Analysis and perspectives
At the end of the fiscal year 2013, the Group announced its intention to focus its efforts on improving its profitability. The significant increase in the Group's financial performances during the fiscal year 2014 materialized a business strategy focused on high-value markets and productivity gains within the Group's production entities.
In the wake of 2014, the fiscal year 2015 confirmed the growth of the Group's profitability resulting from this business strategy. This dynamic enabled the Group to generate free cash flow and to significantly strengthen its net cash which represented 13% of the shareholders’ equity at December 31, 2015.
MEMSCAP intends to pursue this strategy in the coming year while expanding its international sales network.
Q1 2016 earnings: April 19, 2016
Annual meeting of shareholders: May 6, 2016
About MEMSCAP
MEMSCAP is the leading provider of innovative micro-electro-mechanical systems (MEMS)-based solutions. MEMSCAP standard and custom products and solutions include components, component designs (IP), manufacturing and related services. MEMSCAP customers include Fortune 500 businesses, major research institutes and universities. The company's shares are traded on the Eurolist of NYSE Euronext Paris S.A (ISIN: FR0010298620-MEMS) and belong to the CAC small, CAC Mid & Small, CAC All-Tradable and CAC All-Share indexes. More information on the company's products and services can be obtained at www.memscap.com.
CONSOLIDATED STATEMENT OF FINANCIAL POSITION
at 31 December 2015
|
31 December 2015 |
31 December 2014 |
|||
| €000 | €000 | |||
| Assets | ||||
| Non-current assets | ||||
| Property, plant and equipment | 3 151 | 3 057 | ||
| Goodwill and intangible assets | 8 254 | 8 635 | ||
| Available-for-sale financial assets | 1 265 | 1 277 | ||
| Deferred tax asset | 1 103 | 1 107 | ||
| 13 773 | 14 076 | |||
| Current assets | ||||
| Inventories | 2 793 | 2 809 | ||
| Trade and other receivables | 2 051 | 2 591 | ||
| Prepayments | 138 | 237 | ||
| Cash and short-term deposits | 2 636 | 2 494 | ||
| 7 618 | 8 131 | |||
| Total assets | 21 391 | 22 207 | ||
| Equity and liabilities | ||||
| Equity | ||||
| Issued capital | 1 782 | 1 772 | ||
| Share premium | 18 675 | 18 771 | ||
| Treasury shares | (133) | (117) | ||
| Retained earnings | (394) | (1 656) | ||
| Foreign currency translation | (2 168) | (1 972) | ||
| 17 762 | 16 798 | |||
| Non-current liabilities | ||||
| Interest-bearing loans and borrowings | 1 068 | 1 282 | ||
| Employee benefit liability | 54 | 199 | ||
| 1 122 | 1 481 | |||
| Current liabilities | ||||
| Trade and other payables | 1 883 | 2 224 | ||
| Interest-bearing loans and borrowings | 451 | 1 150 | ||
| Other current financial liabilities | 95 | 476 | ||
| Provisions | 78 | 78 | ||
| 2 507 | 3 928 | |||
| Total liabilities | 3 629 | 5 409 | ||
| Total equity and liabilities | 21 391 | 22 207 |
CONSOLIDATED STATEMENT OF INCOME
For the year ended 31 December 2015
| 2015 | 2014 | |||
| €000 | €000 | |||
| Continuing operations | ||||
| Sales of goods and services | 12 623 | 13 152 | ||
| Revenue | 12 623 | 13 152 | ||
| Cost of sales | (8 009) | (9 070) | ||
| Gross profit | 4 614 | 4 082 | ||
| Other income | 503 | 508 | ||
| Research and development expenses | (1 673) | (1 856) | ||
| Selling and distribution costs | (783) | (592) | ||
| Administrative expenses | (1 851) | (1 772) | ||
| Operating profit / (loss) | 810 | 370 | ||
|
Finance costs |
(207) |
(276) |
||
| Finance income | 61 | 86 | ||
| Profit / (loss) for the year from continuing operations before tax | 664 | 180 | ||
|
Income tax expense |
-- |
-- |
||
| Profit / (loss) for the year from continuing operations | 664 | 180 | ||
| Profit / (loss) for the year | 664 | 180 | ||
| Earnings per share: | ||||
|
- Basic, for profit / (loss) for the year attributable to ordinary
equity |
€ 0.09 |
€ 0.03 |
||
|
- Diluted, for profit / (loss) for the year attributable to
ordinary equity |
€ 0.09 |
€ 0.03 |
CONSOLIDATED STATEMENT OF COMPREHENSIVE INCOME
For the year ended 31 December 2015
| 2015 | 2014 | |||
| €000 | €000 | |||
| Profit / (loss) for the year | 664 | 180 | ||
| Items that will not be reclassified subsequently to profit or loss | ||||
| Actuarial gains / (losses) | 129 | (95) | ||
| Income tax on items that will not be reclassified to profit or loss | -- | -- | ||
| Total items that will not be reclassified to profit or loss | 129 | (95) | ||
| Items that may be reclassified subsequently to profit or loss | ||||
| Net gain / (loss) on available-for-sale financial assets | (12) | (2) | ||
| Hedging instruments | 319 | (395) | ||
| Exchange differences on translation of foreign operations | (196) | (130) | ||
| Income tax on items that may be reclassified to profit or loss | -- | -- | ||
| Total items that may be reclassified to profit or loss | 111 | (527) | ||
| Other comprehensive income for the year, net of tax | 240 | (622) | ||
| Total comprehensive income for the year, net of tax | 904 | (442) |
CONSOLIDATED STATEMENT OF CHANGES IN EQUITY
For the year ended 31 December 2015
|
(In thousands of euros, except for number of shares) |
Number of shares |
Issued capital |
Share premium |
Treasury shares |
Retained earnings |
Foreign
currency |
Total
shareholders’ |
|||||||
| €000 | €000 | €000 | €000 | €000 | €000 | |||||||||
| At 1 January 2014 | 6 943 718 | 1 736 | 20 383 | (123) | (3 074) | (1 842) | 17 080 | |||||||
|
Profit for the year |
-- |
-- |
-- |
-- |
180 |
-- |
180 |
|||||||
| Other comprehensive income for the period, net of tax | -- | -- | -- | -- | (492) | (130) | (622) | |||||||
| Total comprehensive income | -- | -- | -- | -- | (312) | (130) | (442) | |||||||
| Capital increase | 145 497 | 36 | 101 | -- | (14) | -- | 123 | |||||||
| Retained earnings offset with share premium | -- | -- | (1 713) | -- | 1 713 | -- | -- | |||||||
| Treasury shares | -- | -- | -- | 6 | -- | -- | 6 | |||||||
| Share-based payment | -- | -- | -- | -- | 31 | -- | 31 | |||||||
| At 31 December 2014 | 7 089 215 | 1 772 | 18 771 | (117) | (1 656) | (1 972) | 16 798 | |||||||
| At 1 January 2015 | 7 089 215 | 1 772 | 18 771 | (117) | (1 656) | (1 972) | 16 798 | |||||||
|
Profit for the year |
-- |
-- |
-- |
-- |
664 |
-- |
664 |
|||||||
| Other comprehensive income for the period, net of tax | -- | -- | -- | -- | 436 | (196) | 240 | |||||||
| Total comprehensive income | -- | -- | -- | -- | 1 100 | (196) | 904 | |||||||
| Capital increase | 39 471 | 10 | 43 | -- | -- | -- | 53 | |||||||
| Retained earnings offset with share premium | -- | -- | (139) | -- | 139 | -- | -- | |||||||
| Treasury shares | -- | -- | -- | (16) | -- | -- | (16) | |||||||
| Share-based payment | -- | -- | -- | -- | 23 | -- | 23 | |||||||
| At 31 December 2015 | 7 128 686 | 1 782 | 18 675 | (133) | (394) | (2 168) | 17 762 | |||||||
CONSOLIDATED CASH FLOW STATEMENT
For the year ended 31 December 2015
| 2015 | 2014 | |||
| €000 | €000 | |||
| Cash flows from operating activities: | ||||
| Net profit / (loss) for the year | 664 | 180 | ||
| Non-cash items written back: | ||||
| Amortization and depreciation | 836 | 817 | ||
| Loss / (capital gain) on disposal of fixed assets | 12 | (11) | ||
| Other non-financial activities | (96) | 257 | ||
| Accounts receivable | 547 | 86 | ||
| Inventories | (23) | 863 | ||
| Other debtors | (121) | (185) | ||
| Accounts payable | (221) | (271) | ||
| Other liabilities | (106) | 11 | ||
| Total net cash flows from operating activities | 1 492 | 1 747 | ||
|
Cash flows from investing activities: |
||||
| Purchase of fixed assets | (288) | (379) | ||
| Proceeds from sale / (purchase) of financial assets | (16) | (148) | ||
| Total net cash flows from investing activities | (304) | (527) | ||
|
Cash flows from financing activities: |
||||
| Repayment of borrowings | (522) | (577) | ||
| Payment of finance lease liabilities | (114) | (108) | ||
| Sale / (purchase) of treasury shares | (16) | 6 | ||
| Proceeds from issue of shares | 53 | 124 | ||
| Total net cash flows from financing activities | (599) | (555) | ||
|
Net foreign exchange difference |
88 |
119 |
||
| Increase / (decrease) in net cash and cash equivalents | 677 | 784 | ||
| Opening cash and cash equivalents balance | 1 959 | 1 175 | ||
| Closing cash and cash equivalents balance | 2 636 | 1 959 |
View source version on businesswire.com: http://www.businesswire.com/news/home/20160321006167/en/
 Der finanzen.at Ratgeber für Aktien!
Wenn Sie mehr über das Thema Aktien erfahren wollen, finden Sie in unserem Ratgeber viele interessante Artikel dazu!
Jetzt informieren!
Nachrichten zu Memscap S.A.mehr Nachrichten
| Keine Nachrichten verfügbar. |
Analysen zu Memscap S.A.mehr Analysen
Aktien in diesem Artikel
| Memscap S.A. | 3,33 | -1,19% |

|
Letzte Top-Ranking Nachrichten
Nachrichten
Oskar ist der einfache und intelligente ETF-Sparplan. Er übernimmt die ETF-Auswahl, ist steuersmart, transparent und kostengünstig.